Amazing-Python-Scripts
..
/
Data-Visualization
README.md
Data Visualizations
Data Visualization is the presentation of data in graphical format. It helps people understand the significance of data by summarizing and presenting huge amount of data in a simple and easy-to-understand format and helps communicate information clearly and effectively.
Setup Instructions
For the visualizations, we require plotly and you can install it with the following command
pip install plotly
Outputs
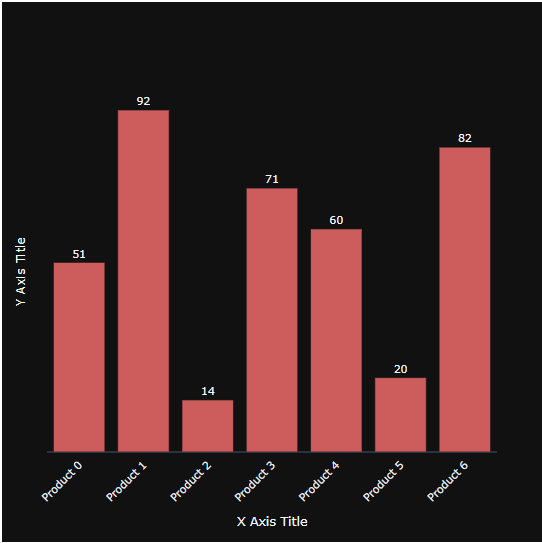
1. Bar Chart
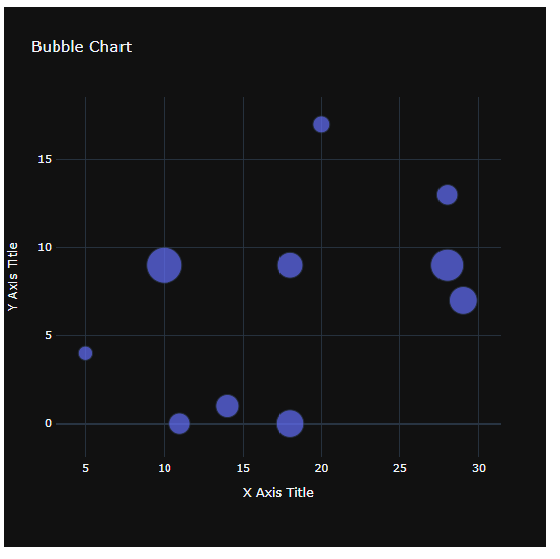
2. Bubble Chart
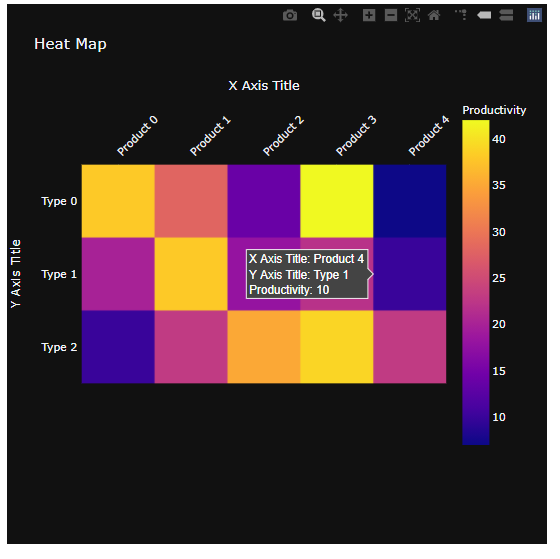
3. Heat Map
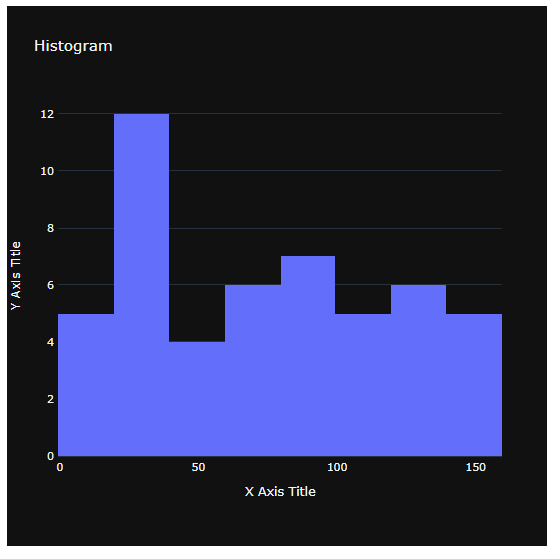
4. Histogram Plot
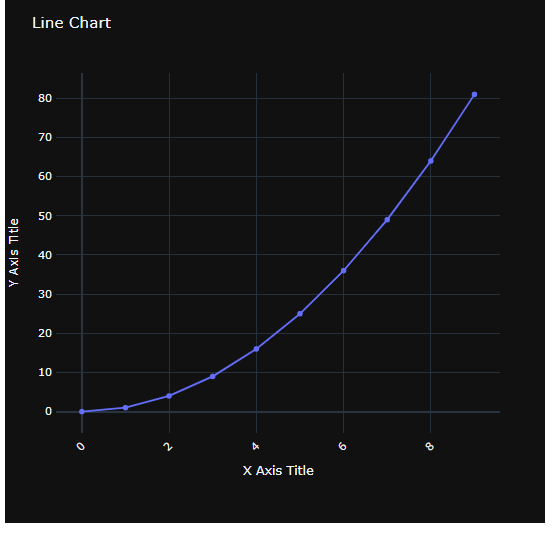
5. Line Chart
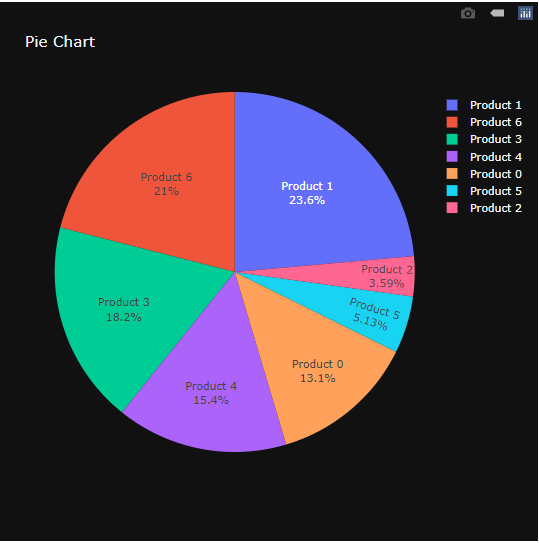
6. Pie Chart
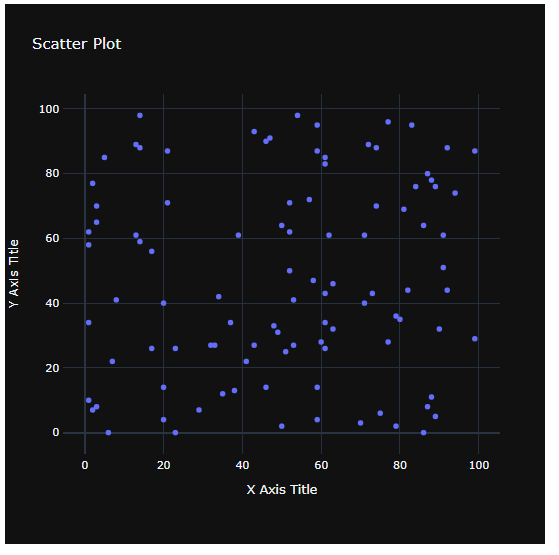
7. Scatter Plot
Author
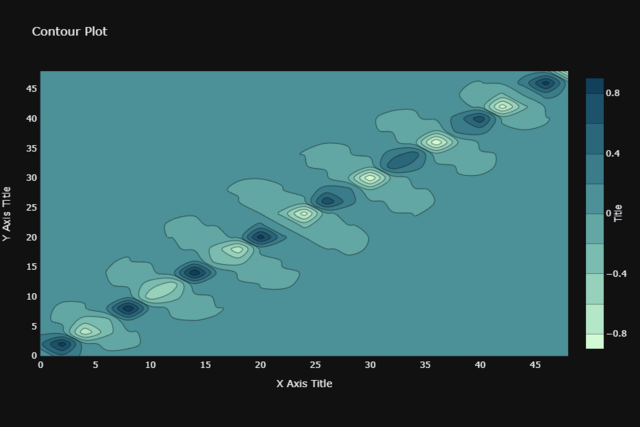
8. Contour Plot
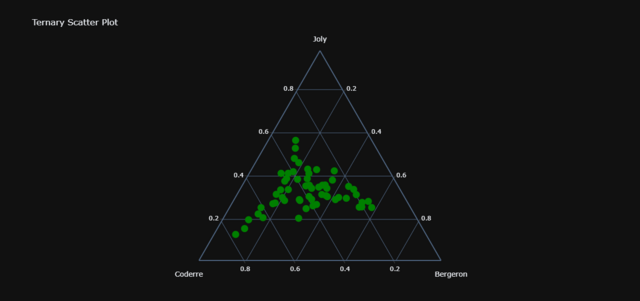
9. Ternary Plot
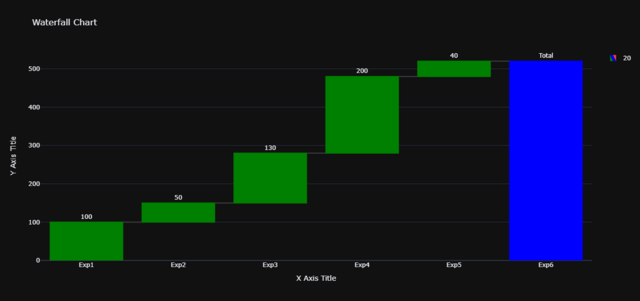
10. Waterfall Chart
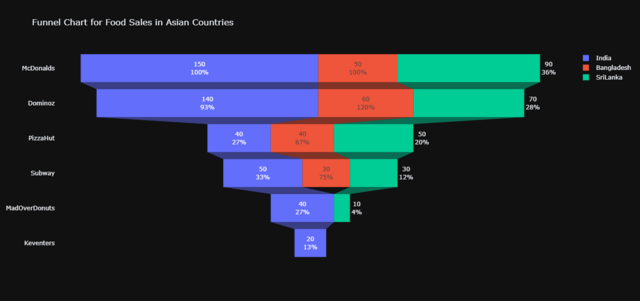
11. Funnel Chart